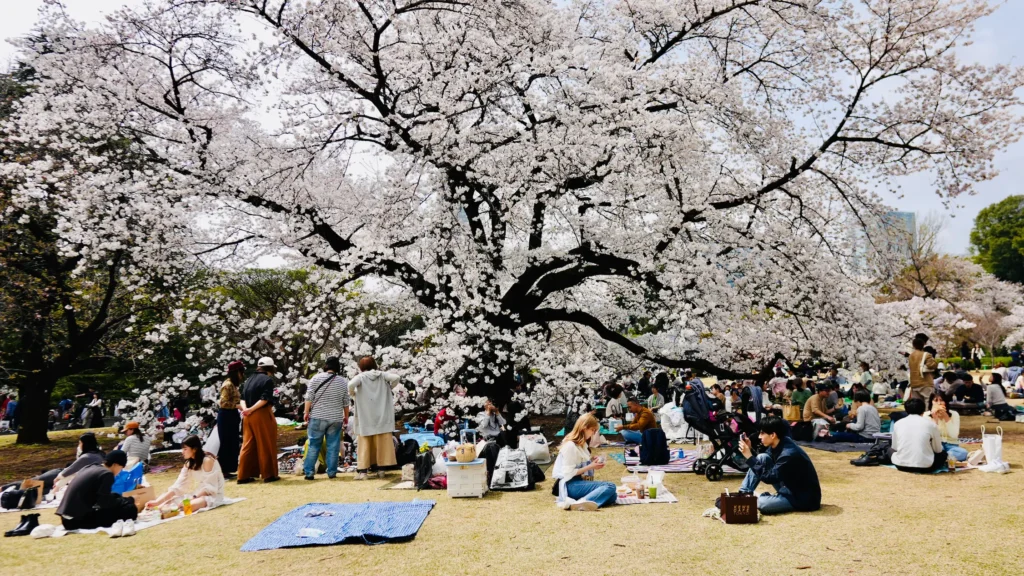
Cherry blossom season is the heart of Japanese tourism, driving a massive wave of international visitors and local celebration. Because the stakes are so high, various agencies invest heavily in complex models to provide the most accurate Japan cherry blossom forecast possible.
Predicting the exact “kaika” (flowering) and “mankai” (full bloom) is an immense scientific task. Forecasters must calculate dormancy breaking by analyzing autumn chill, winter cold spells, and the rapidly changing temperatures of early spring.
The Benchmark Tree Secret
It is important to note that the official cherry blossom forecast from the Japan Meteorological Agency (JMA) specifically tracks only the Somei Yoshino variety. Furthermore, the forecast is based on a single “benchmark tree” in each city. For example, the Tokyo cherry blossom forecast relies entirely on a specific Somei Yoshino tree at Yasukuni Shrine.
Because weather events are unpredictable, relying purely on early forecasts can lead to major disappointment if you’ve booked your trip to Tokyo with the sole goal of seeing full bloom.
This post explains how to read cherry blossom forecast, the different botanical stages of cherry blossom, and examines the history of forecast accuracy, in order to derive a strategy for using the forecast effectively.
How to read cherry blossom forecast
The forecasts are published on Japan Meteorological Agency website: https://n-kishou.com/corp/news-contents/sakura/?lang=en
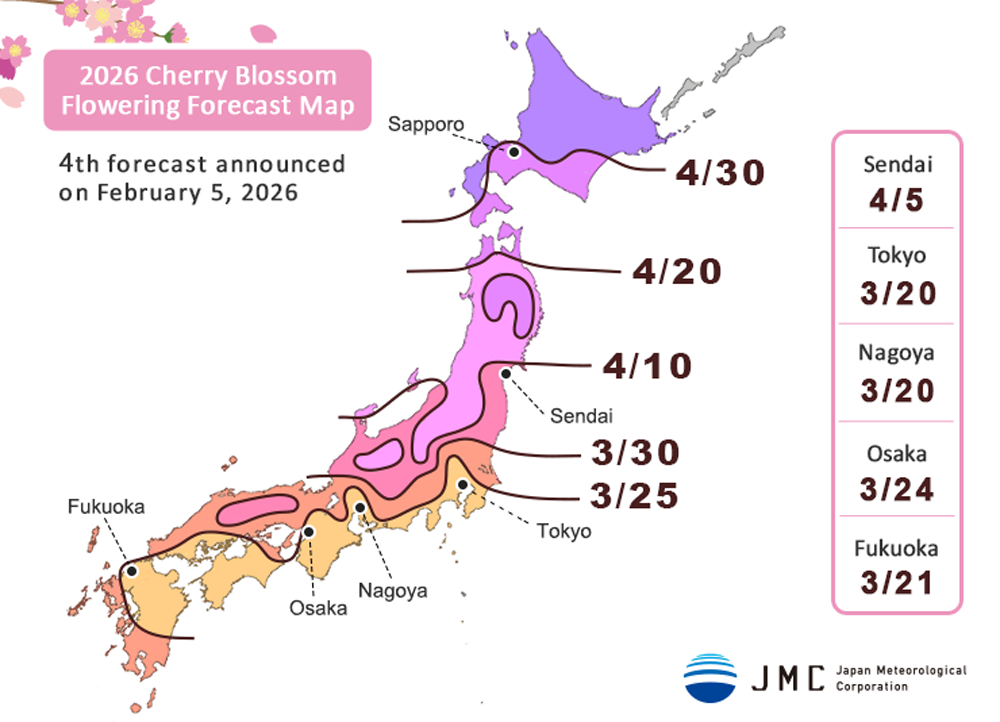
Each year, five forecasts are issued. The first is issued in December, followed by updates every few weeks as the agency incorporates temperature information as it becomes available. The last forecast is issued in March.
A typical forecast includes a map like this (Source: JMC)
and a table like this
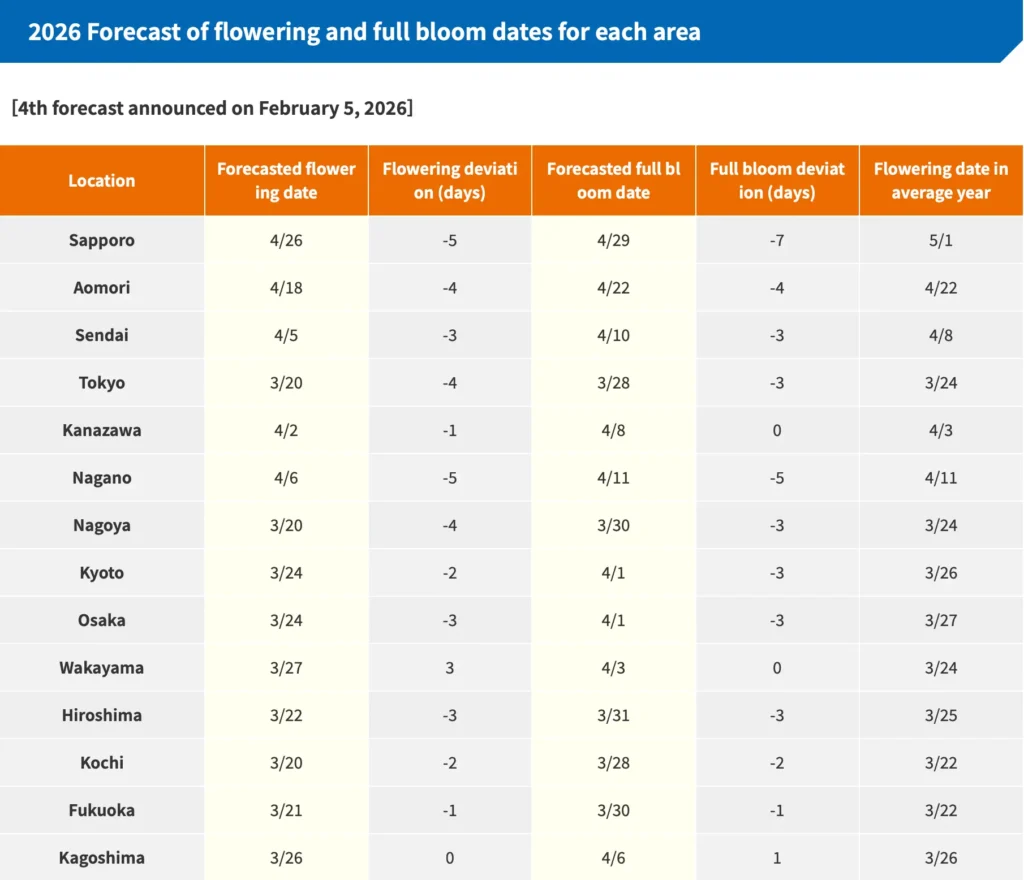
In the map, the dates shown are when the flowers are predicted to begin to open. This is called Kaika in Japanese. When the first 5 buds on a cherry tree open, the tree is said to have entered the Kaika period. The date of Kaika is shown in the “Forecasted flowering date” column in the table.
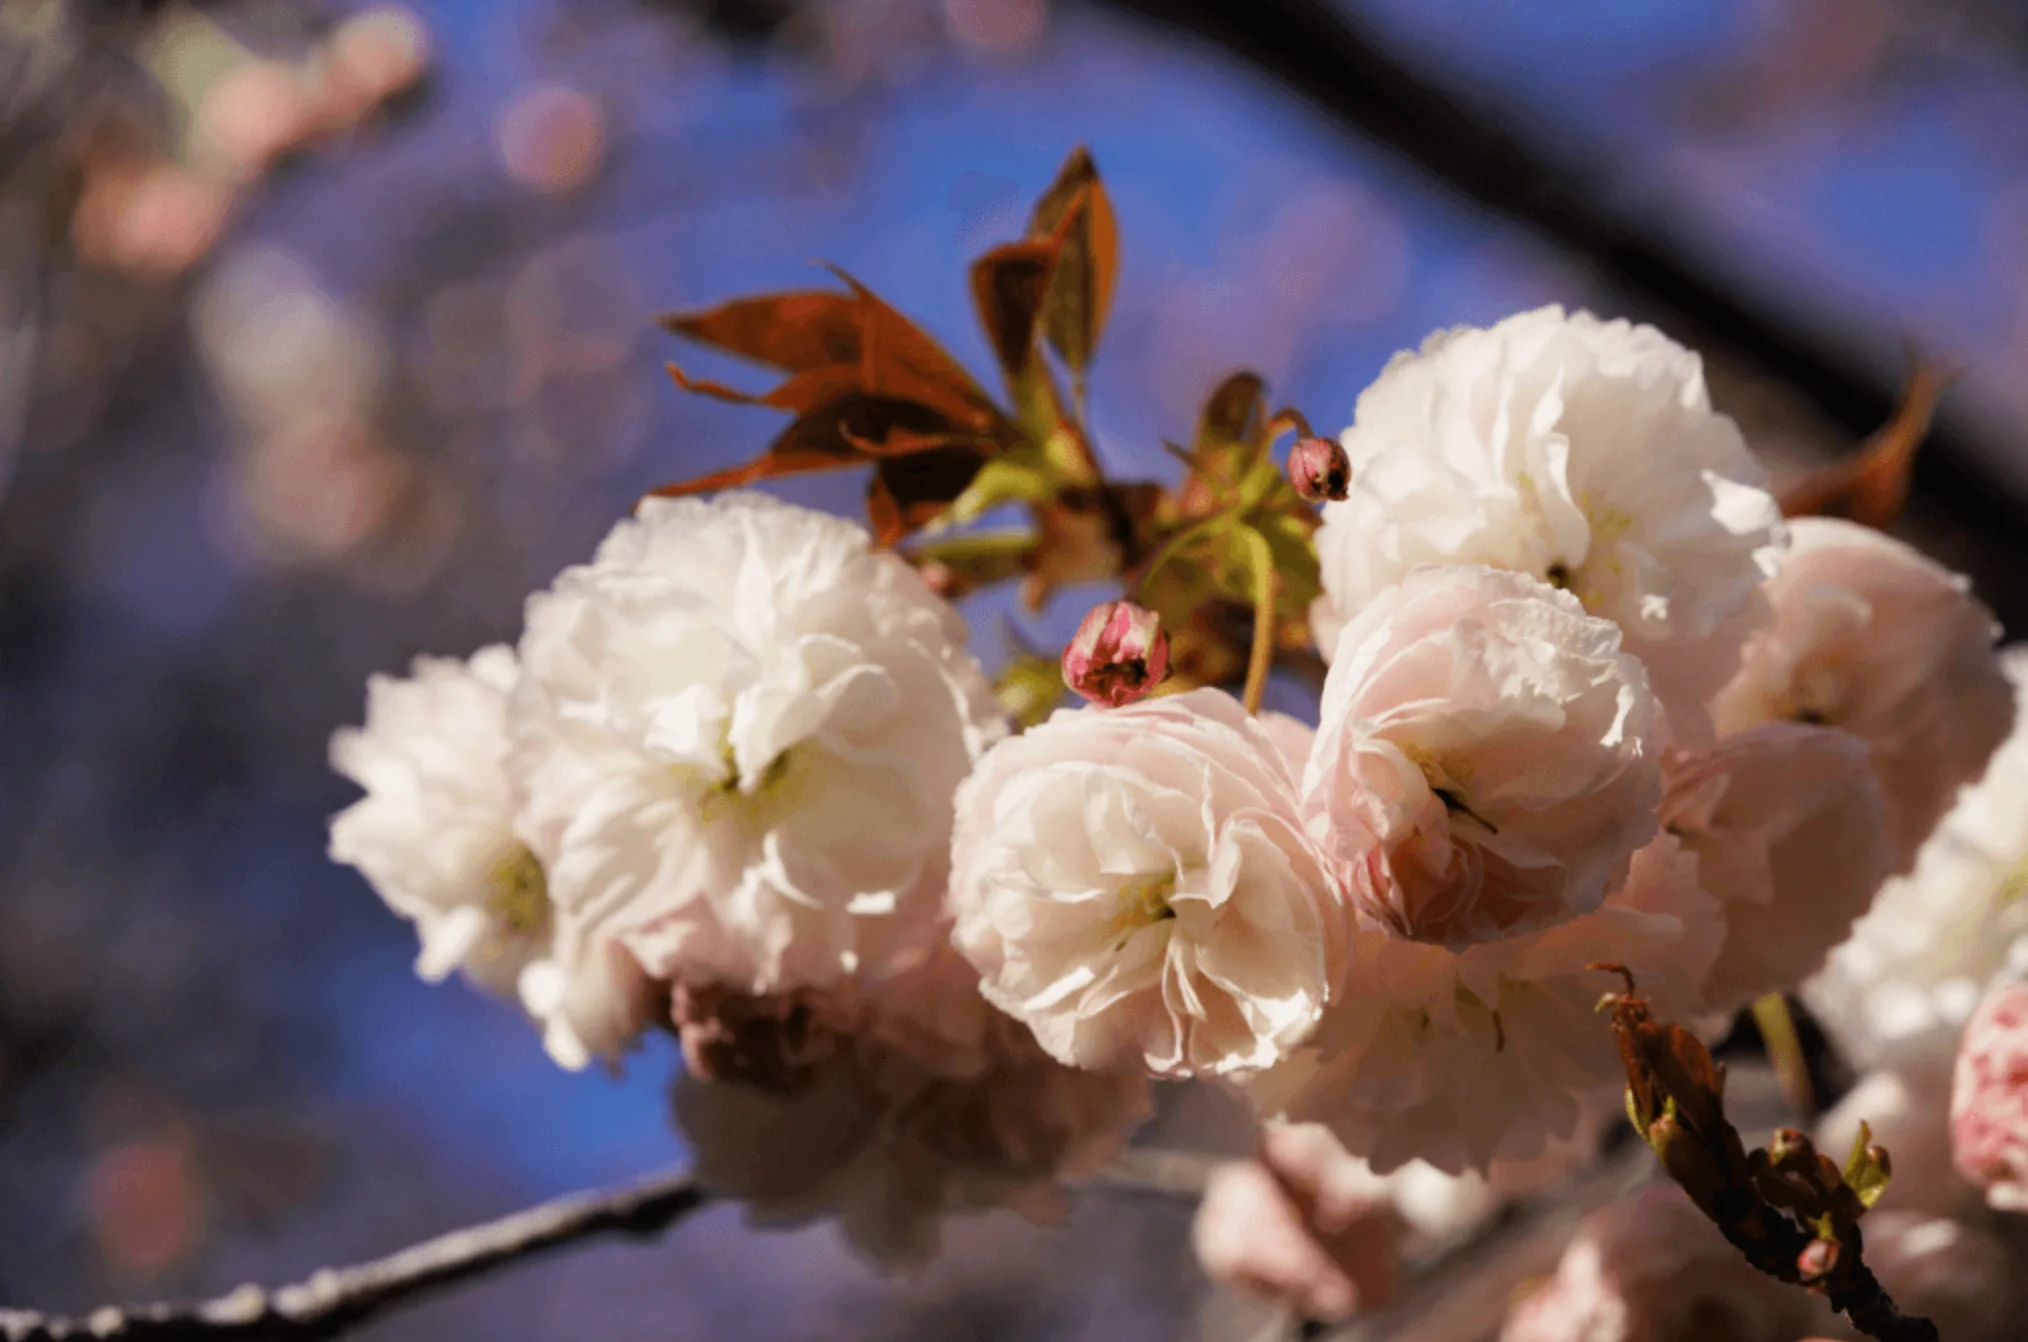
In the forecast table, the “Forecasted full bloom date” column shows the dates when at least 80% of the buds of the trees have opened. Full bloom is called Mankai. The visual effect of Mankai is clouds of flowers. It is a dreamy sight no pictures can capture.
Cherry blossom stages
Here is a serious botanically accurate description of cherry blossom stages
(Source: Vancouver Cherry Blossom Festival)
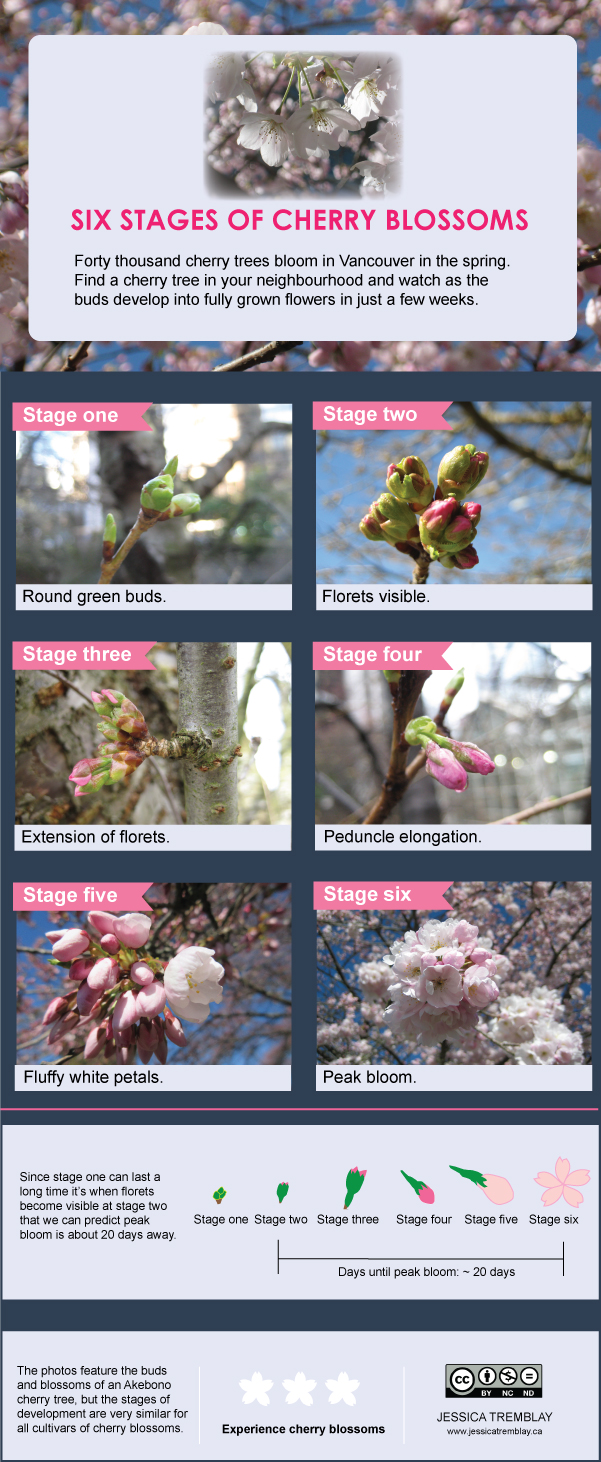
You’ll notice that it takes about a week for the transition from Kaika to Mankai. For example, in Tokyo, Kaika is forecasted on 3/22, and Mankai is forecasted on 3/29. In Kyoto, Kaika is forecasted on 3/25, and Mankai is forecasted on 4/2.
Mankai period is short. Heavy rain and wind might wipe out the petals and shorten Mankai to just a few days, while prolonged period of sunshine and calm weather helps extend Mankai to a week.
Following Mankai, the petals start falling off en-mass. This causes the flower blizzard phenomenon, Hanafubuki, when millions of cherry blossom petals fly around in the wind. This is an especially beautiful time.
The entire blooming period, from when the buds open, until the petals have completely fallen off, is 10-14 days.
Comparing the forecast history with actual blooming dates
The website www.sakura-weathermap.jp keeps records of past forecasts as well as actual blooming time, going back to 2010. The website is in Japanese, but for English speakers, here’s a link to the translation provided by Google.
The website notes the weather pattern and temperature changes preceding cherry blossom season each year. Then, it compares the forecasted flowering dates with the actual flowering date.
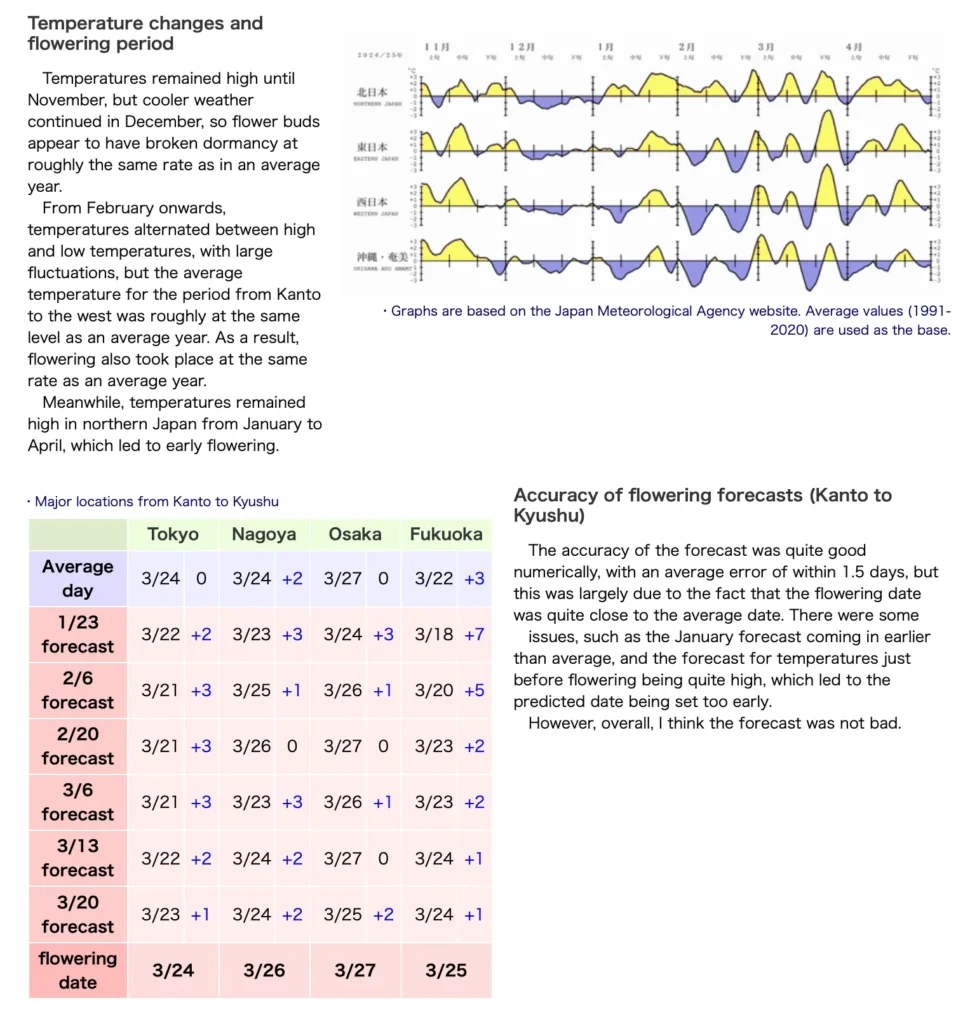
Based on these data, I have compiled the following table of “Forecasted Flowering Date” vs. “Actual Flowering Date” and “Actual Mankai Date” for Tokyo:
| Year | 1st Forecast (Jan/Feb) |
Final Forecast (Late March) |
Actual Bloom Date |
vs 1st Forecast |
vs 2nd Forecast |
Actual Mankai Date |
Accuracy Notes |
|---|---|---|---|---|---|---|---|
| 2025 | March 21 | March 21 | March 24 | +3 | +3 | March 30 | Early heat led to very early initial projections. |
| 2024 | March 19 | March 24 | March 29 | +10 | +5 | April 4 | Forecast was 5-10 days early due to late March cold snap. |
| 2023 | March 22 | March 16 | March 14 | -8 | -2 | March 22 | Record March heat caused bloom to beat all forecasts. |
| 2022 | March 23 | March 21 | March 20 | -3 | -1 | March 27 | Generally accurate; slightly earlier than expected. |
| 2021 | March 18 | March 15 | March 14 | -4 | -1 | March 22 | Tied record for earliest bloom; heat surpassed models. |
| 2020 | March 19 | March 16 | March 14 | -5 | -2 | March 22 | Record early bloom; forecasts adjusted late. |
| 2019 | March 22 | March 21 | March 21 | -1 | 0 | March 27 | Highly accurate year with stable temperatures. |
| 2018 | March 23 | March 19 | March 17 | -6 | -2 | March 24 | Earlier than forecast due to a heat wave. |
| 2017 | March 24 | March 22 | March 21 | -3 | -1 | April 2 | Slow start followed by quick progression. |
| 2016 | March 22 | March 21 | March 21 | -1 | 0 | March 31 | Forecasts captured the timing well. |
| 2015 | March 26 | March 24 | March 23 | -3 | -1 | March 29 | Slightly earlier than initial models predicted. |
| 2014 | March 28 | March 26 | March 25 | -3 | -1 | March 30 | Regular spring progression; accurate final updates. |
| 2013 | March 25 | March 18 | March 16 | -9 | -3 | March 22 | Unexpectedly early; forecasts missed by a week. |
| 2012 | March 26 | March 30 | March 31 | +5 | +1 | April 6 | Late bloom due to cold winter; forecasts late. |
| 2011 | March 25 | March 27 | March 28 | +3 | +1 | April 6 | Delayed slightly by cool March air. |
| 2010 | March 22 | March 22 | March 22 | 0 | 0 | April 1 | JMA’s final year; perfectly accurate. |
*Table scrollable horizontally on mobile. Data compiled from historical JMA and WeatherNews reports.
Here are some insights from this table:
– Average Date: The historical average for Mankai in Tokyo is March 31.
– Volatile Timing: The dates have ranged from as early as March 22 (2020, 2021, 2023) to as late as April 6 (2011, 2012).
– Impact of Global Warming: In recent years (2020–2025), the bloom has tended to occur earlier than the long-term 30-year average. But in the past two years, the bloom have occurred later than forecasted.
Strategies for using the forecast
The most visually impressive sights are Mankai and Hanafubuki. Therefore, when using the official cherry blossom forecasts to plan your trip, focus on the “Forecasted full bloom date”. You don’t want to arrive on the “Forecasted flowering date” only to find out only a few buds have opened!
If you’re planning to be in Tokyo for just a few days and still want to see cherry blossom, then it would be a good idea to arrive a bit later than the “Forecasted full bloom date”. The reason is that you will have a high likelihood of seeing peak bloom as well as flower blizzard. If you are staying in Tokyo for 1-2 week, then arriving a bit later will give you an opportunity to see the late-blooming cherry varieties (yaezakura). (Quick tip: hotels rate after the Somei Yoshino peak bloom are often cheaper.)
Of course, if you prefer seeing the peak bloom of the Somei Yoshino, which is undoubtedly beautiful, then arriving a bit earlier than the “Forecasted full bloom date” would be recommended.
Leave a Reply